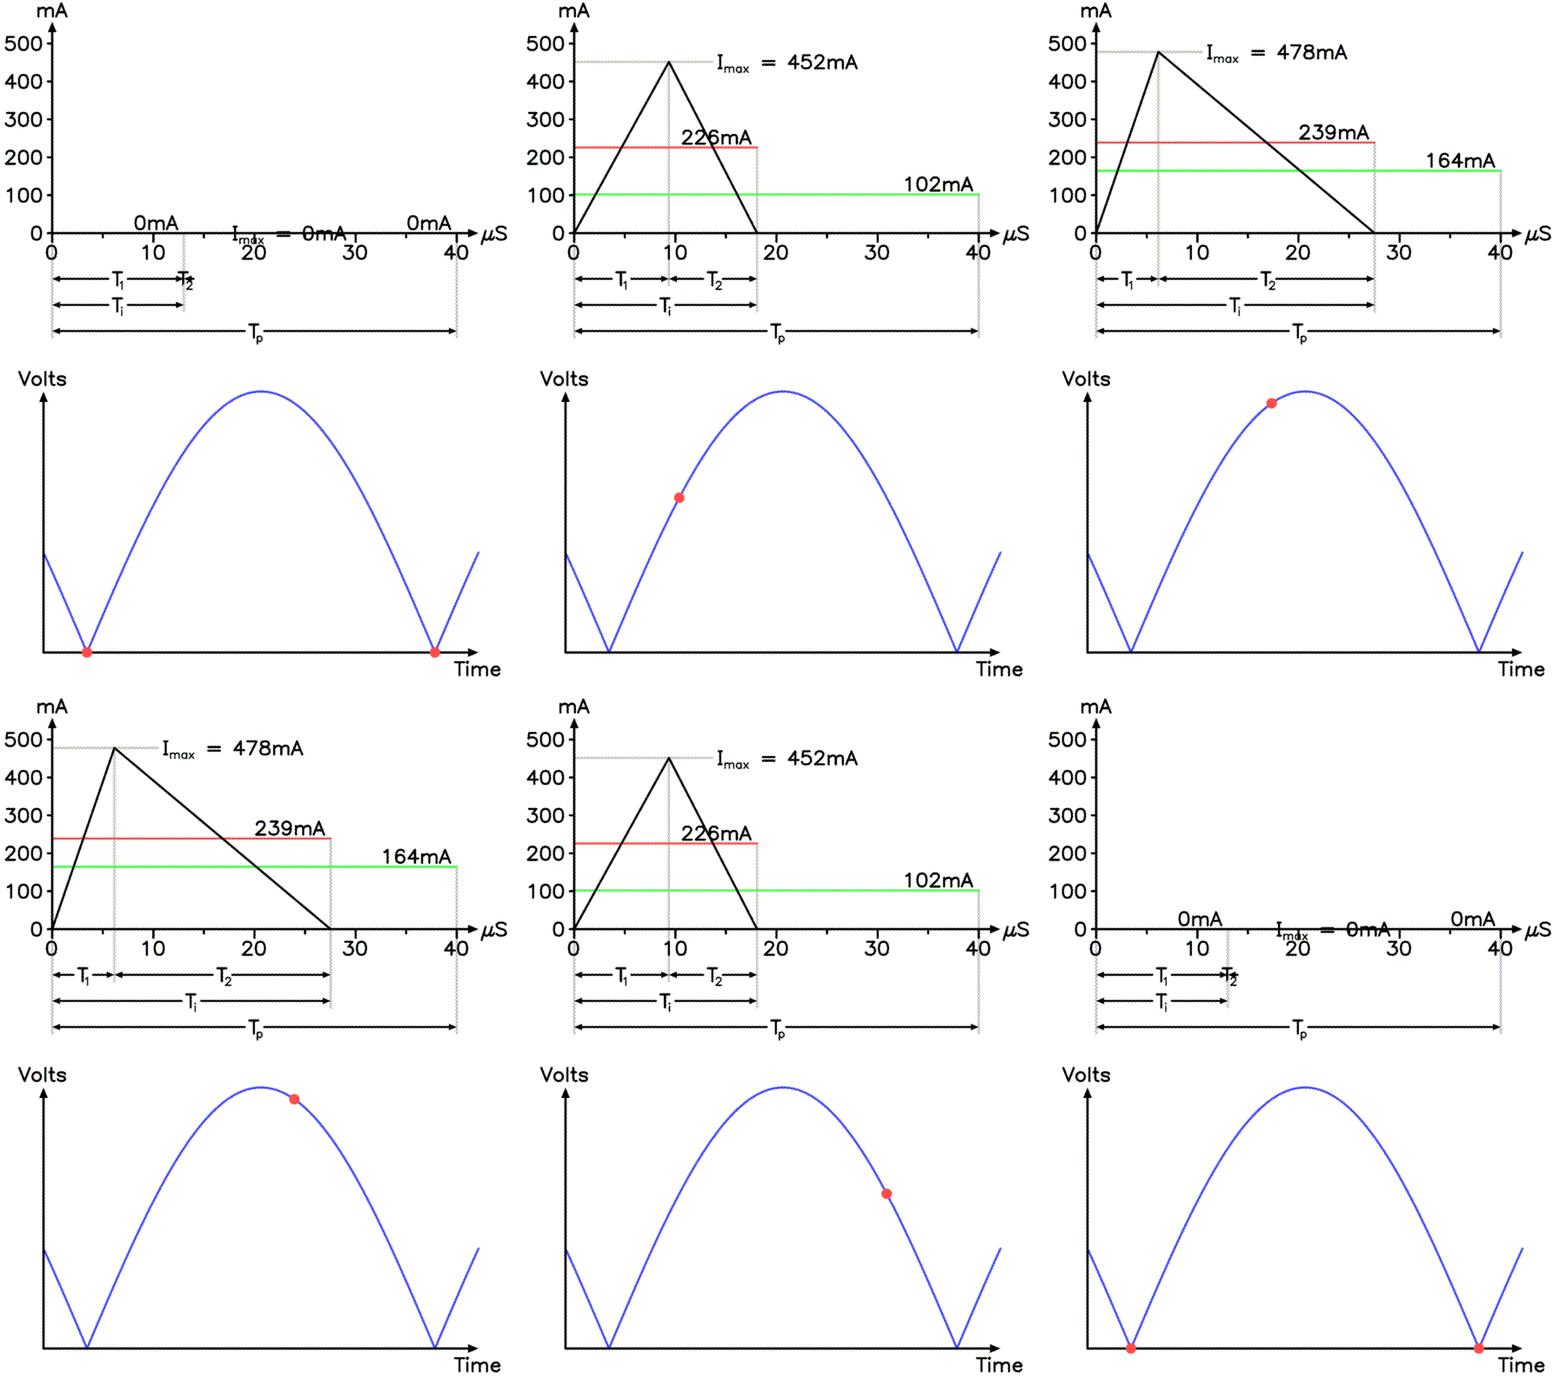
This page shows how the PFC boost pulse varies over time as a function of the full wave rectified AC line input voltage.

The diagram at top shows the pulse parameters at the particular point on the rectified AC line input indicated by the red dot at bottom.
This animation simulates the test platform circuit with 115V AC input and drawing 14 watts of power. It therefore presents a 945 ohm load to the power line.
Note that the current drawn from the AC line (green, at top) is always proportional to the AC line voltage, as is characteristic of a resistive load.
It is also interesting to note that the peak inductor current does not occur
at the peak of the AC line.